Can ChatGPT Make Infographics?
Yes, ChatGPT can indeed be used to create interactive infographics that are not only visually appealing but also provide dynamic, real-time responses to user queries. This marks a shift from traditional static infographics, making data more accessible and engaging for users. Let’s break this down and explore how ChatGPT can revolutionize infographics, the benefits of using such advanced AI, practical examples, potential applications, and some challenges that come with incorporating this technology.
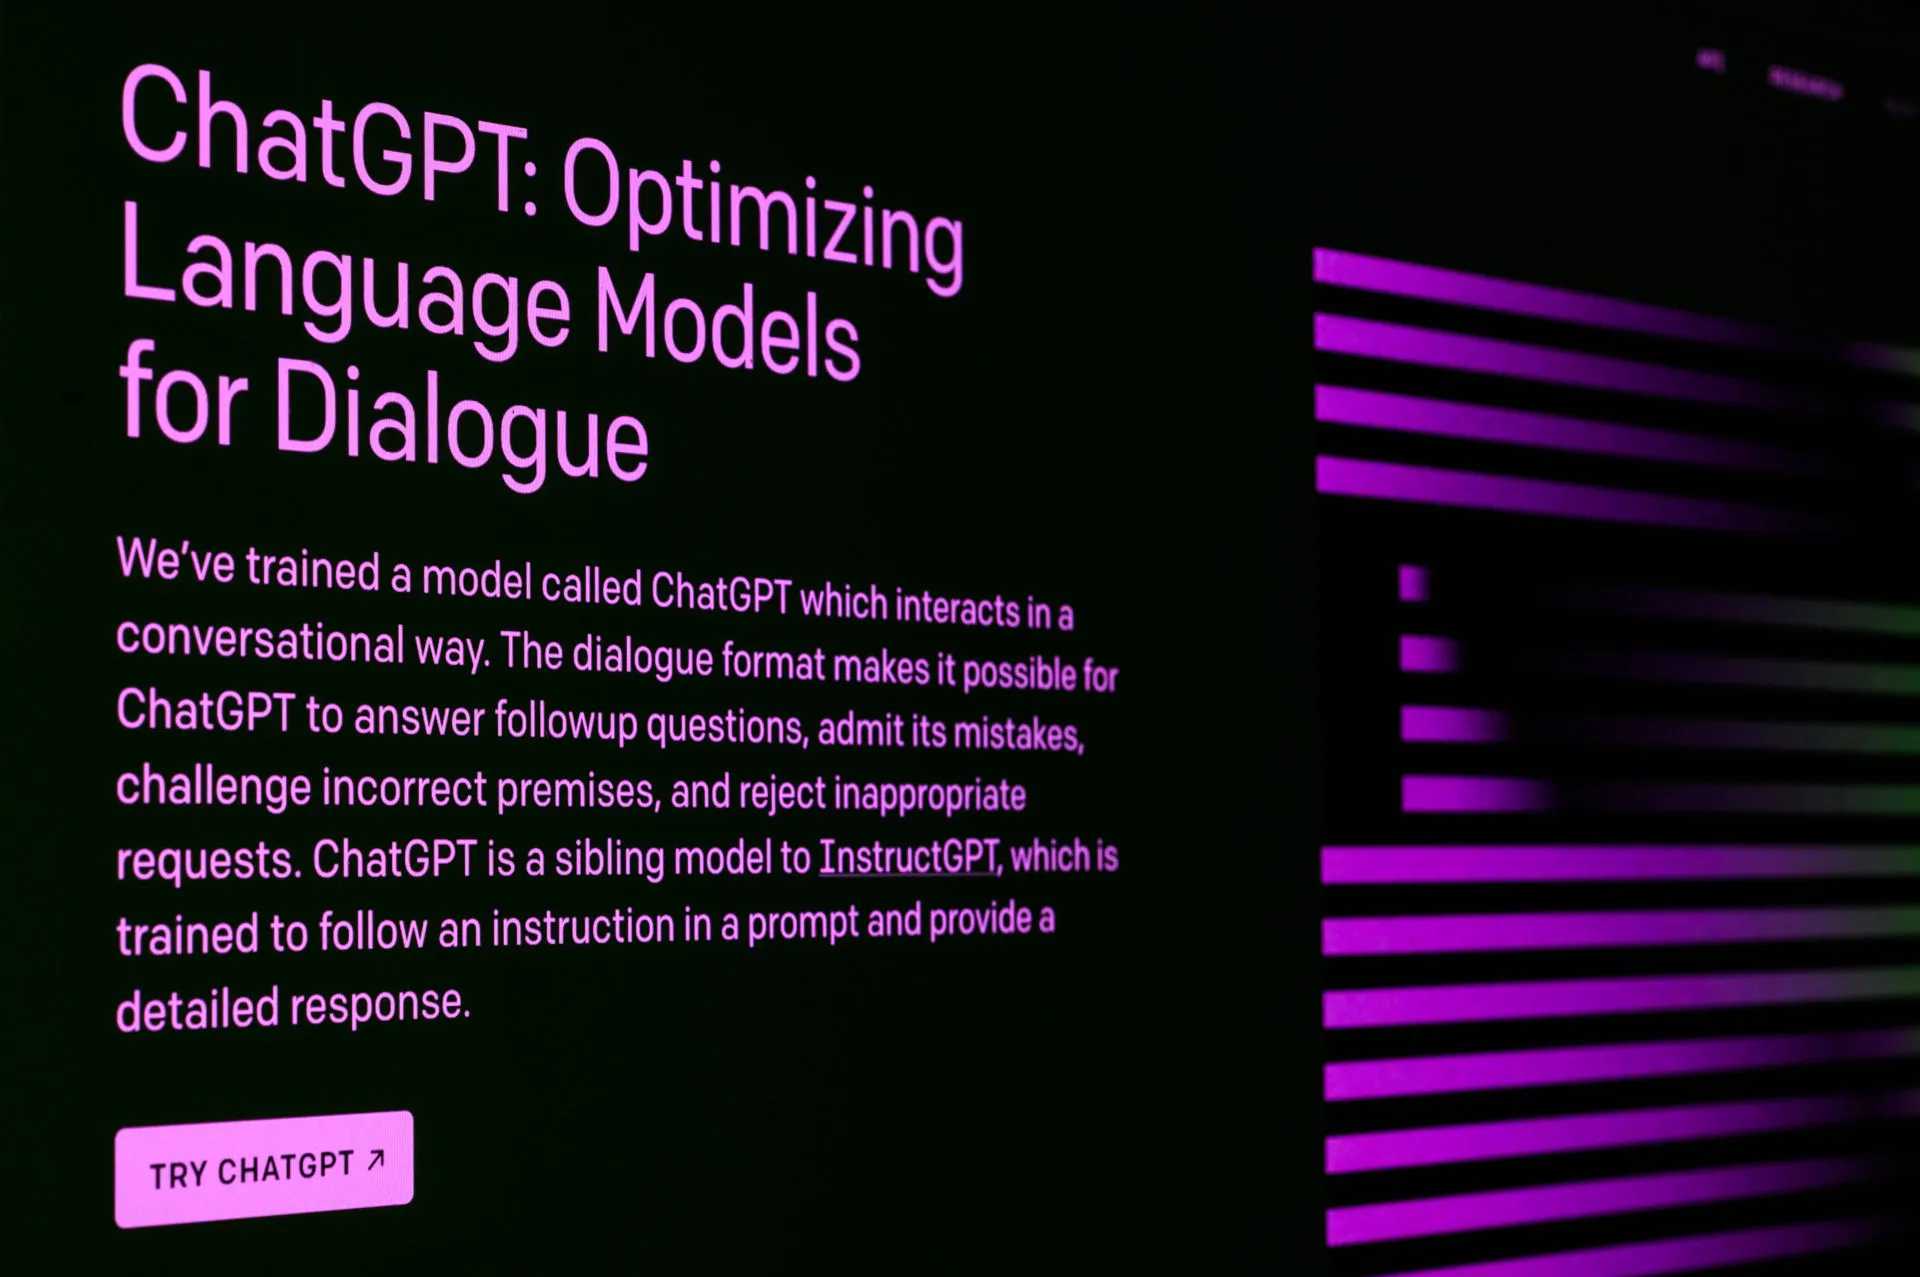
Introduction to ChatGPT
If you’ve been living under a rock or just beamed down from Mars recently, allow me to intro you to ChatGPT. ChatGPT, short for « Chat Generative Pre-trained Transformer, » is the brainchild of OpenAI. Essentially, it’s an impressive AI language model that’s been finely tuned for conversational text. Think of it as a hyper-intelligent parrot that can engage in conversations, answer your questions, and even help create personalized content.
What sets ChatGPT apart from your run-of-the-mill chatbots is its incredible knack for understanding and generating human language. It’s the holy grail for natural language processing tasks, making it ideal for everything from crafting engaging marketing copy to powering conversational agents. And now, we’re stepping into the realm of infographics. ChatGPT isn’t just a chatterbox; it’s a creator who can breathe life into interactive data visuals that can make complex subjects more enjoyable and understanding for the average reader.
How ChatGPT Can Be Used for Interactive Infographics
So, how does one go about harnessing the power of ChatGPT to create infographics that actually engage? Well, for starters, let’s talk interactivity! Imagine having an infographic about climate change that not only shows the frightening stats but allows you to click on different regions of the world to understand how local initiatives are making a difference. ChatGPT can power these interactive elements by generating informative and accurate content on demand.
For example, if a user clicks on a specific landmark in an infographic about the history of a city, they can ask ChatGPT, « What’s the story behind this building? » And just like that, the model churns out a well-researched, narrative response, replete with timelines and quirky anecdotes about the site’s historical significance. Interactive infographics made with ChatGPT can significantly enhance the user’s experience by making the content not just visually stunning but also richly informative.
Another cool feature? ChatGPT can generate entire sections of an infographic based on user input. For instance, if the subject is a company’s annual financial performance, users can ask for clarification on different financial metrics and receive in-depth analysis. Instead of allowing users to gloss over numbers, you draw them in for a conversation, making the content more accessible and engaging.
Advantages of Using ChatGPT for Interactive Infographics
Now you might be thinking, « What’s the big deal? Tumbling numbers and pie charts are already out there. » But hold your horses! Here are a few reasons why integrating ChatGPT into interactive infographics is as revolutionary as it gets:
- Engagement: We live in an age where people’s attention spans are shorter than that of a goldfish. By using ChatGPT, your infographics are transformed from flat, static displays into dynamic experiences that keep audiences clicking, asking questions, and learning in real-time.
- Accessibility: ChatGPT’s human-like conversational tone makes complex jargon less intimidating. It breaks down heavy data into easily digestible snippets that audiences can understand, regardless of their background.
- Efficient Content Generation: Let’s not sugarcoat it—working on infographics can be tedious. By letting ChatGPT handle the dialogue and explanations, you save precious time and resources. It’s like having a super assistant that takes care of the mundane stuff, freeing you up to focus on design and creativity.
- Customizable Experiences: Every user is unique, and their needs will vary. ChatGPT allows for tailored responses based on user interactions, creating a personalized experience that can cater to diverse audiences and contexts.
Examples of Interactive Infographics Created with ChatGPT
The world is ripe for innovative applications of ChatGPT in infographic creation, and the results can be nothing short of groundbreaking. Here are a few examples that jump out:
- Travel Infographics: Picture an infographic showcasing key historical landmarks in Paris. Users can click on each landmark and ask questions like, « What’s the backstory of the Eiffel Tower? » ChatGPT fills in the details, providing insights that make them feel like a local historian.
- Educational Infographics: An educational infographic could delve into various human anatomy topics, allowing students to click on different organs and posing questions like, « What are the common diseases affecting the heart? » ChatGPT can provide detailed explanations, diagrams, and recent studies on each subject to enhance learning.
- Financial Performance Infographics: As mentioned earlier, imagine a company’s financial overview pop-up where users can query metrics. “What does net income tell me about the company’s health?” ChatGPT provides tailored analysis, important for investors or interested parties.
- Healthcare Infographics: In times of global pandemics, interactive health information is crucial. Users could inquire about COVID-19 symptoms and health agencies’ best practices, while ChatGPT arms them with the most current data and advice.
- Consumer Behavior Infographics: How about an infographic showcasing consumer trends over time? Users could engage by asking, « How did social media affect buying habits in the past ten years? » ChatGPT dives into the historical context and statistics, illuminating the path from then to now.
Potential Use Cases for ChatGPT in Interactive Infographics
The possibilities seem limitless when we talk about potential use cases for ChatGPT in various sectors:
- Education: Besides the aforementioned examples, we can create subject-specific infographics in science, history, or literature. Learners can ask any doubts about the content and receive well-explained responses instantaneously.
- Business: For businesses, ChatGPT can create infographics that explain sales metrics, customer demographics, and marketing insights, making it an invaluable tool for business strategists and analysts.
- Marketing: Imagine using ChatGPT to create interactive marketing campaigns. You could engage consumers with quizzes that assess preferences and then suggest tailored products, making them feel valued and understood.
- Healthcare: Beyond mere data representation, healthcare facilities can use infographics to demystify personal health assessments, treatments, and preventative measures, allowing users to ask their health questions directly.
- Tourism: ChatGPT can assist in crafting engaging travel guides that offer historical anecdotes, travelers’ anecdotes, and practical tips, all in real-time conversation by simply clicking through the infographic.
Challenges and Limitations of Using ChatGPT for Interactive Infographics
Nevertheless, even the most groundbreaking technology has its challenges, and ChatGPT is no exception. Here are some hurdles you might encounter:
- Accuracy: ChatGPT relies on its training data, and while it’s often impressive, it can produce erroneous or incomplete answers. Developers must ensure fine-tuning with targeted datasets to achieve the necessary accuracy for specific use cases.
- Complexity in Responses: There are scenarios where the user’s question may lead to intricate discussions that exceed ChatGPT’s bandwidth to generate concise and straightforward answers. Content creators need to set limits or define the conversation scope.
- Technical Limitations: Implementing ChatGPT into an infographic may require substantial technical resources and expertise backstage, limiting accessibility for smaller businesses or independent creators who could otherwise leverage these interactive features.
- User Interactivity: While the intention is to foster engagement through questions and discussions, not everyone may feel comfortable interacting with AI. Implementing tutorials or guides may be essential to ease users into the experience.
Conclusion: The Future of Infographics with ChatGPT
In a world filled with data overload, innovations such as ChatGPT’s integration into interactive infographics emerge, fulfilling the pressing need for actionable insights presented in an easily digestible format. The combination of visual storytelling melded seamlessly with intelligent interaction offers a glimpse into the future, making analytics not just functional but fun.
So, whether you’re a curious traveler wanting to know what makes the Colosseum special or a business analyst dissecting quarterly results, you’ll find ChatGPT-led interactive infographics to be compelling companions in your quest for knowledge. With the promise of intelligent conversation attached to graphic representation, we see a new dawn of digital storytelling that’s not only responsive but also empathetic. Now, the only question left is: Are you ready to take your infographics to the next level?